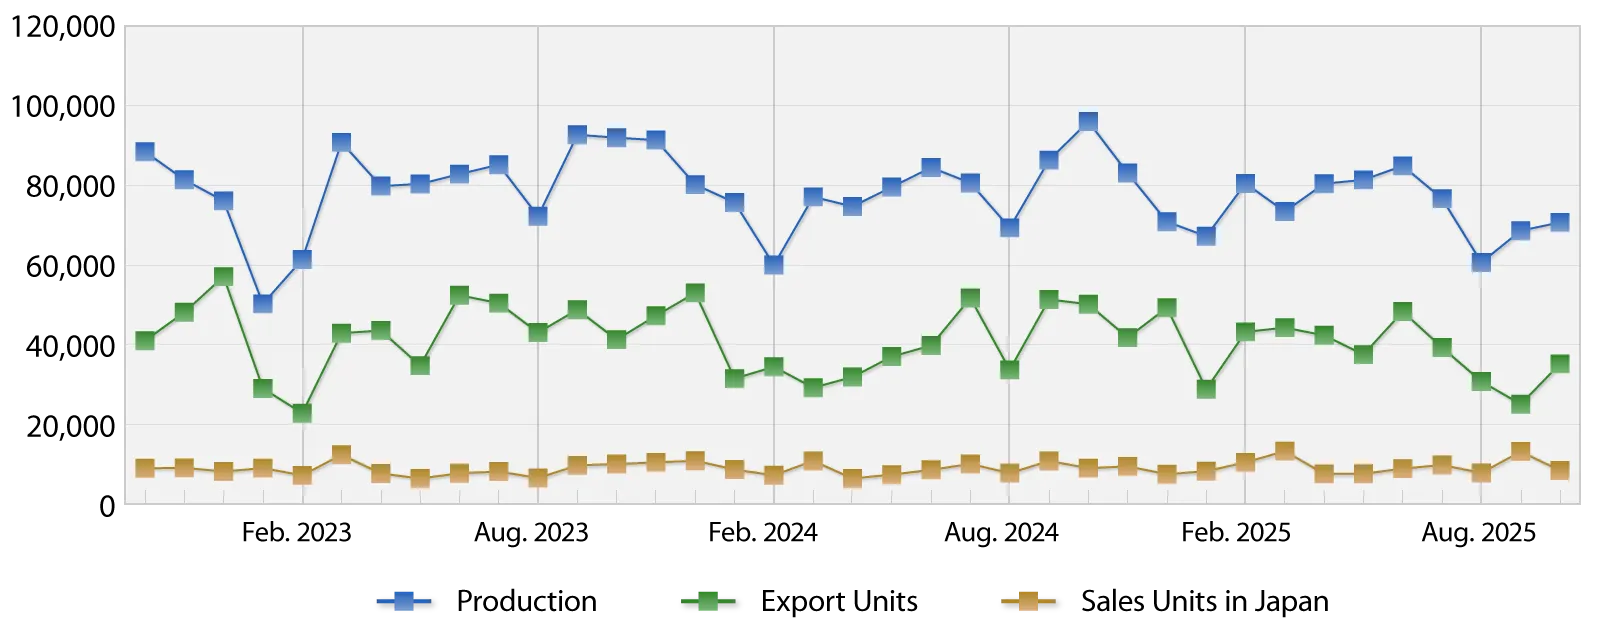
Production, Sales, Export results
Latest Data
Update: January 29, 2026
Changes in automobile production, sales, export units

- Production, Japan Sales, Export Results
- Global Sales Results
Results for December 2025 and CY 2025
December 2025
| Dec 2025 | YoY | |||||
|---|---|---|---|---|---|---|
| Domestic production | 40,210 | −16.9% | 7th consecutive month of decrease | |||
| Overseas production | 27,146 | +20.8% | First increase in 5 months | |||
| Global production total | 67,356 | −5.0% | 6th consecutive month of decrease | |||
| Passenger vehicles | 6,741 | +6.6% | First increase in 3 months | |||
| Mini vehicles | 1,445 | +25.0% | First increase in 2 months | |||
| Japan sales total | 8,186 | +9.4% | First increase in 3 months | |||
| Export total | 36,547 | −25.8% | 6th consecutive month of decrease | |||
January – December 2025
| Jan–Dec 2025 | YoY | |||||
|---|---|---|---|---|---|---|
| Domestic production | 540,194 | −5.5% | 2nd consecutive year of decrease | |||
| Overseas production | 337,822 | −7.7% | First decrease in 4 years | |||
| Global production total | 878,016 | −6.4% | 2nd consecutive year of decrease | |||
| Passenger vehicles | 95,610 | +4.3% | 3rd consecutive year of increase | |||
| Mini vehicles | 15,687 | +31.9% | First increase in 3 years | |||
| Japan sales total | 111,297 | +7.5% | First increase in 2 years | |||
| Export total | 447,367 | −7.1% | 2nd consecutive year of decrease | |||
Notes:
- Domestic production: JAMA (Japan Automobile Manufacturers Association Inc.) report basis (CBU)
- Overseas production: Local line-off basis
- Export: JAMA report basis
- Figures are based on the information available at the time of announcement
