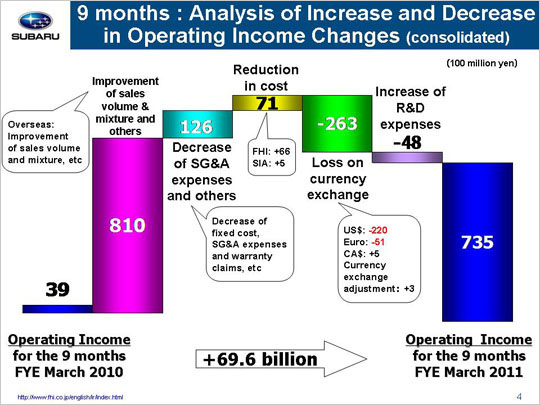
| Let’s look at the factors that brought operating income up year on year from 3.9 billion to 73.5 billion yen. The primary factor for the earnings increase was a gain of 81.0 billion yen due to improvement of sales volume & mixture and others. This gain can be broken down into three areas. First, we had a loss of 2.5 billion yen from declining domestic automobile sales that began falling off after October when the eco-car subsidy programs were terminated. Next, we saw a gain of 78.1 billion yen in overseas markets due to increased sales volumes as well as an improved sales mixture. Finally, another gain of 5.4 billion yen due to inventory adjustments. We also saw a decrease in SG&A expenses and others that led to a gain of 12.6 billion yen. This amount can be broken down into three areas. First, we see that a reduction in fixed manufacturing costs generated a gain of 7.3 billion yen, with a gain of 7.7 billion yen coming from FHI and a loss of 0.4 billion yen (4 million dollars) at SIA. FHI yielded a gain of 5.5 billion yen due to decrease of the depreciation of suppliers’ dies and a gain of 2.2 billion yen due to lower fixed processing costs. SIA gained 0.9 billion yen (9 million dollars) due to decrease of the depreciation of suppliers’ dies and lost 1.3 billion yen (13 million dollars) due to increased processing costs. Next we see that a drop in SG&A expenses produced a gain totaling 1.1 billion yen. FHI generated a loss of 2.6 billion yen due to increased freight charge and shipping costs with the increasing sales volume. Domestic dealers, on the other hand, generated a gain of 2.4 billion yen thanks to their ongoing effort to lower SG&A expenses. SOA generated a gain of 1.2 billion yen (12 million dollars), including 3.1 billion yen (32 million dollars) from reduced advertising and SG&A expenses despite a loss of 1.9 billion yen (20 million dollars) due to increased incentives. Although the per-unit incentives was reduced approximately 150 dollars, down from 1,050 dollars for April-December 2009 to 900 dollars for April-December 2010, the actual incentive amounts was up due to the increased sales volume. Our Canadian subsidiary made a loss of 0.6 billion yen (6 million dollars) due to an increased incentives, etc. while our other subsidiaries saw combined gains of 0.7 billion yen. Finally, the third factor includes a decrease in warranty claims costs that led to a gain of 4.2 billion yen. A reduction in materials costs resulted in a gain of 7.1 billion yen, with 6.6 billion yen at FHI and 0.5 billion yen at SIA. The 7.8 billion yen loss FHI experienced as a result of material price raise was offset by a gain totaling 14.4 billion yen generated through a reduction in materials costs. While SIA gained 4.2 billion yen (44 million dollars), it lost 3.7 billion yen (40 million dollars) due to the material price raise. Operating income dipped 26.3 billion yen on foreign exchange losses. This included a loss of 22.0 billion yen due to an approximate 7 yen appreciation against the U.S. dollar, a loss of 5.1 billion yen due to an approximate 19 yen appreciation against the euro, and a gain of 0.5 billion yen due to an approximate one yen depreciation against the Canadian dollar. This figure also includes a gain of 0.3 billion yen due to foreign exchange adjustments for transactions between FHI and its overseas subsidiaries. An increase in R&D expenses from 26.8 billion yen to 31.6 billion yen also resulted in a loss of 4.8 billion yen. These factors combined brought operating income up 69.6 billion yen. |