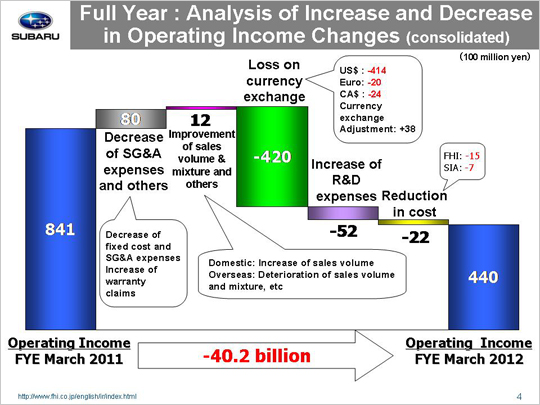
| Let’s look at the reasons behind the year-on-year decrease of 40.2 billion yen in operating income that went from 84.1 billion yen to 44.0 billion yen. The primary reason for the increase in operating income was a gain of 8.0 billion yen from reductions in SG&A expenses. This gain can be broken down into the following three areas. First, we see that a reduction in fixed manufacturing costs generated a gain of 5.1 billion yen, with a gain of 3.5 billion yen coming from FHI and another gain of 1.6 billion yen at SIA. FHI yielded a gain of 7.0 billion yen due to cost cuts for suppliers’ dies and a loss of 3.5 billion yen due to lower fixed processing costs. SIA lost 0.1 billion yen due to increased costs for suppliers’ dies and gained 1.7 billion yen due to a reduction in fixed processing costs. Next we see that a drop in SG&A expenses produced a gain totaling 4.3 billion yen. This includes a gain of 6.1 billion yen generated at FHI due to reduced SG&A expenses on top of a drop in transportation and packing costs accompanying the decreasing sales volume. Domestic dealers experienced a loss of 0.5 billion yen. SOA generated a gain of 2.7 billion yen due to a reduction in sales incentives. We also saw a loss of 0.4 billion yen at our Canadian subsidiary while our other subsidiaries saw combined losses of 3.6 billion yen. The third and last factor includes an increase in costs associated with warranty claims that led to a loss of 1.4 billion yen. This loss was due to an allowance for recalls. Another factor for the increase in operating income was an improved sales mix variance that led to a gain of 1.2 billion yen. This gain can be broken down into the following three areas. First, we saw a gain of 5.3 billion yen in domestic new car sales. A full recovery of production and sales in the second half as well as the major facelift for the Impreza drove passenger car sales up. Our overseas operations, on the other hand, generated a loss of 17.6 billion yen due to falling production and shipments in the first half, following on the heels of the devastating earthquake. Then finally, we had a gain of 13.5 billion yen due to inventory adjustments. Major factors that kept profits down included a foreign exchange loss of 42.0 billion yen. This includes a loss of 41.4 billion yen due to an approximate 7 yen appreciation against the U.S. dollar, a loss of 2.0 billion yen due to an approximate 6 yen appreciation against the euro, and a loss of 2.4 billion yen due to an approximate 6 yen appreciation against the Canadian dollar. This figure also includes a gain of 3.8 billion yen due to foreign exchange adjustments for transactions between FHI and its overseas subsidiaries. Increases in R&D expenses resulted in a loss of 5.2 billion yen. Another factor behind the decrease in operating income was a loss of 2.2 billion yen related to material costs, with a loss of 1.5 billion yen generated by FHI and a loss of 0.7 billion yen coming form SIA. While FHI generated a gain of 3.1 billion yen from reduced material costs, it experienced a loss of 4.6 billion yen due to hikes in material prices and an ailing market. SIA also yielded a gain of 4.0 billion yen by cutting material costs but lost 4.7 billion yen due to adverse market conditions. These factors combined brought consolidated operating income for the fiscal year ended March 2012 down 40.2 billion yen to total 44.0 billion yen. |