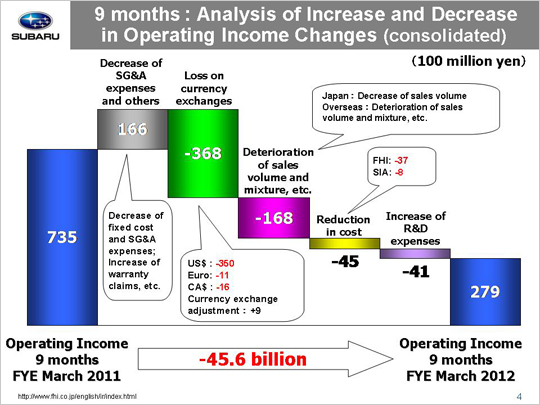
| Now let’s look at the factors behind the 45.6 billion yen year-on-year drop that saw operating income fall from 73.5 billion yen to 27.9 billion yen. The primary reason for the increase in operating income was a gain of 16.6 billion yen from reductions in SG&A expenses. This gain can be broken down into the following three areas. First, we see that a reduction in fixed manufacturing costs generated a gain of 9.1 billion yen, with a gain of 7.2 billion yen coming from FHI and another gain of 1.9 billion yen (22 million dollars) at SIA. FHI yielded a gain of 6.1 billion yen due to cost cuts for suppliers’ dies and a gain of 1.1 billion yen due to lower fixed processing costs. SIA gained 0.1 billion yen due to cost cuts for suppliers’ dies and 1.8 billion yen due to a reduction in fixed processing costs. Next we see that a drop in SG&A expenses produced a gain totaling 9.7 billion yen. This includes a gain of 6.0 billion yen generated at FHI due to reduced SG&A expenses on top of a drop in transportation and packing costs accompanying the decreasing sales volume. Domestic dealers yielded a gain of 0.8 billion yen due to cuts in SG&A expenses. SOA generated a gain of 4.5 billion yen (53 million dollars) due to a reduction in sales incentives. We also saw a gain of 0.2 billion yen at our Canadian subsidiary while our other subsidiaries saw combined losses of 1.8 billion yen. The gain generated by SOA includes a gain of 0.3 billion yen (4 million dollars) from reduced advertising expenses, etc. as well as a gain of 4.2 billion yen (49 million dollars) from a 250 dollar reduction in the per-unit cash-back rebate, bringing it down from 900 dollars for April-December 2010 to 650 dollars for April-December 2011. The third and last factor includes an increase in costs associated with warranty claims that led to a loss of 2.2 billion yen. This loss comes from an allowance for recalls posted in the second and third quarters. The major causes leading to the profit downturn included exchange rate fluctuations that generated a loss of 36.8 billion yen. This figure includes a loss of 35.0 billion yen due to an approximate 8 yen appreciation against the U.S. dollar, loss of 1.1 billion yen due to an approximate 5 yen appreciation against the euro, and a loss of 1.6 billion yen due to an approximate 6 yen appreciation against the Canadian dollar. The 36.8 billion yen loss also includes a gain of 0.9 billion yen due to foreign exchange adjustments for transactions between FHI and its overseas subsidiaries. Among the factors that took a bite out of our operating income was an unfavorable sales mix variance that led to a loss of 16.8 billion yen. This loss can be broken down into the following three areas. First we saw a loss of 1.8 billion yen in domestic operations. Although the pace of production and sales recovery picked up in the third quarter, the first half's low sales volume in the wake of the 311 earthquake had a major impact on our operating results. Next, our overseas operations generated a loss of 28.8 billion yen due to falling production and shipments in the first half that followed on the heels of the devastating earthquake. Finally, among all these losses we did manage to realize a gain of 13.8 billion yen due to inventory adjustments. Another factor behind the decrease in operating income was a loss of 4.5 billion yen related to material costs, with a loss of 3.7 billion yen generated by FHI and a loss of 0.8 billion yen (9 million dollars) coming form SIA. While FHI generated a gain of 1.0 billion yen from reduced material costs, it experienced a loss of 4.7 billion yen due to hikes in material prices and an ailing market. SIA also yielded a gain of 2.1 billion yen (24 million dollars) by cutting material costs but lost 2.9 billion yen (33 million dollars) due to adverse market conditions. Increases in R&D expenses resulted in a loss of 4.1 billion yen. These factors combined brought operating income for the first nine months of this fiscal year down 45.6 billion yen to total 27.9 billion yen. |