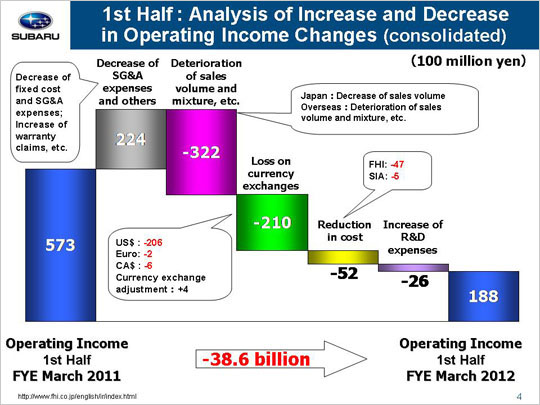
| Now let’s look at the factors behind the 38.6 billion yen year-on-year drop in operating income that took us from 57.3 billion yen to 18.8 billion yen. The primary reason for the increase in operating income was a gain of 22.4 billion yen due to reduced SG&A expenses. Let's look at the three factors behind the increase. First, we see that a reduction in fixed manufacturing costs generated a gain of 9.8 billion yen, with a gain of 8.9 billion yen coming from FHI and another gain of 0.9 billion yen at SIA. FHI yielded a gain of 5.2 billion yen due to cost cuts for suppliers’ dies and a gain of 3.7 billion yen due to lower fixed processing costs. SIA lost 0.1 billion yen due to increased costs for suppliers’ dies and gained 1.0 billion yen due to a reduction in fixed processing costs. Next we see that a drop in SG&A expenses produced a gain totaling 13.7 billion yen. FHI generated a gain of 8.0 billion yen due to reduced advertising costs as well as lower transportation and packing costs as a result of lower sales volumes. Domestic dealers also generated 1.4 billion yen as a result of their efforts to cut SG&A expenses. SOA experienced a gain of 5.2 billion yen, while our Canadian subsidiary generated a loss of 0.1 billion yen and our other subsidiaries saw combined losses totaling 0.8 billion yen. The figure for SOA includes a gain of 1.2 billion yen due to reduced advertising costs, etc. in addition to a gain of 4.0 billion yen. This latter gain comes from an approximate 400 dollar drop in the per-unit rebate that brought the 950 dollar cash-back incentive for April through September 2010 down to 550 dollars for April through September 2011. Finally, the third factor includes an increase in costs associated with warranty claims that led to a loss of 1.1 billion yen. This loss was due to the allowance for recalls posted in the second quarter. Major factors leading to the profit downturn included a loss of 32.2 billion yen due to unhealthy sales mix variances. This loss can be broken down into the following three areas. First we saw a loss of 6.5 billion yen in domestic operations. Although the sales mix improved once we began filling our order backlog for passenger cars, the declining sales volume due to the impact of the earthquake brought performance down. Next, production and shipment disruptions due to the disasters resulted in loss of 31.7 billion yen at our overseas operations. Finally, in addition to these losses we did realize a gain of 6.0 billion yen due to inventory adjustments. Another contributing factor that brought operating income down was a foreign exchange loss of 21.0 billion yen. This includes a loss of 20.6 billion yen due to an approximate 10 yen appreciation against the U.S. dollar, a loss of 0.2 billion yen due to an approximate 2 yen appreciation against the euro, and a loss of 0.6 billion yen due to an approximate 4 yen appreciation against the Canadian dollar. The 21.0 billion yen figure also includes a gain of 0.4 billion yen due to foreign exchange adjustments for transactions between FHI and its overseas subsidiaries. Increases in R&D expenses resulted in a loss of 2.6 billion yen. Despite efforts to reduce material costs, we saw an overall loss of 5.2 billion yen, with a loss of 4.7 billion yen at FHI and a loss of 0.5 billion yen at SIA. Cost cutting measures implemented at FHI actually resulted in a loss of 1.6 billion yen while hikes in material prices and an ailing market added another 3.1 billion yen to the loss column. SIA gained 1.2 billion yen from reduced material costs but lost 1.7 billion yen due to adverse market conditions. These factors combined brought first half operating income down 38.6 billion yen to total 18.8 billion yen. |