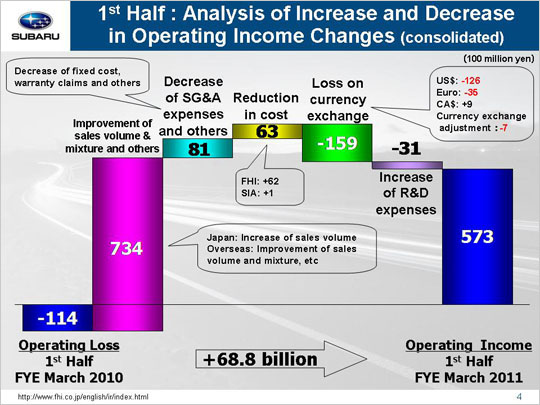
| Let’s look at the reasons behind the year-on-year increase in operating income that went from minus 11.4 billion to 57.3 billion yen. The primary factor for the earnings increase was a gain of 73.4 billion yen due to improvement of sales volume and mixture. This can be broken down into three areas. First, we have a gain of 2.5 billion yen from the increased sales volume for both passenger cars and minicars in the domestic market thanks to a boost from the eco-car purchase subsidy despite the waning impact of the new Legacy. Next, we see an overseas market gain of 61.4 billion yen due to increased sales volumes as well as improved sales mixture. Finally on top of these increases, we have another gain of 9.5 billion yen due to inventory adjustments. A decrease of SG&A expenses and others led to a gain of 8.1 billion yen. This amount can be broken down into three areas. First, we see that a reduction in fixed manufacturing costs generated a gain of 4.4 billion yen, with a gain of 5.0 billion yen coming from FHI and a loss of 0.6 billion yen (6 million dollars) at SIA. FHI yielded a gain of 3.9 billion yen due to cost cuts for suppliers’ dies and a gain of 1.1 billion yen due to lower fixed processing costs. SIA gained 0.6 billion yen (5 million dollars) due to cost cuts for suppliers’ dies and lost 1.2 billion yen (11 million dollars) due to increased processing costs. Next we see that an increase in SG&A expenses produced a loss totaling 0.4 billion yen. FHI generated a loss of 3.3 billion yen due to increasing freight charge and shipping costs with the increasing sales volume. Domestic dealers, on the other hand, generated a gain of 1.4 billion yen due to ongoing efforts to lower SG&A expenses through the integration of dealerships. SOA generated a gain of 3.0 billion yen (32 million dollars). This figure includes a gain of 2.4 billion yen (26 million dollars) due to reduced SG&A expenses, etc. and a gain of 0.6 billion yen (6 million dollars) due to an approximate 350 dollar decrease in the per-unit incentives that brought the 1,300 dollar for April through September 2009 down to 950 dollars for April through September 2010. Our Canadian subsidiary generated a loss of 1.1 billion yen due to an increased sales incentives, etc. while our other subsidiaries saw combined losses of 0.4 billion yen. Finally, the third factor includes a decrease in costs associated with warranty claims that led to a gain of 4.1 billion yen. Reduction in cost resulted in a gain of 6.3 billion yen, with 6.2 billion yen at FHI and 0.1 billion yen at SIA. The 5.8 billion yen loss FHI experienced due to material price raise was offset by a gain totaling 12.0 billion yen generated through cost reductions. While SIA gained 2.9 billion yen (30 million dollars) it ultimately lost 2.8 billion yen (29 million dollars) because of material price raise. Major factors behind the profit downturn included exchange rate fluctuations generating a loss of 15.9 billion yen. In that figure includes a loss of 12.6 billion yen due to an approximate seven yen appreciation against the US dollar, a loss of 3.5 billion yen due to an approximate eighteen yen appreciation against the euro, and a gain of 0.9 billion yen due to an approximate three yen depreciation against the Canadian dollar. The figure also includes a loss of 0.7 billion yen due to foreign exchange adjustments for transactions between FHI and its overseas subsidiaries. An increase in R&D expenses from 17.1 billion yen to 20.3 billion yen also resulted in a loss of 3.1 billion yen. These factors combined brought operating income up 68.8 billion yen for a total of 57.3 billion yen. |