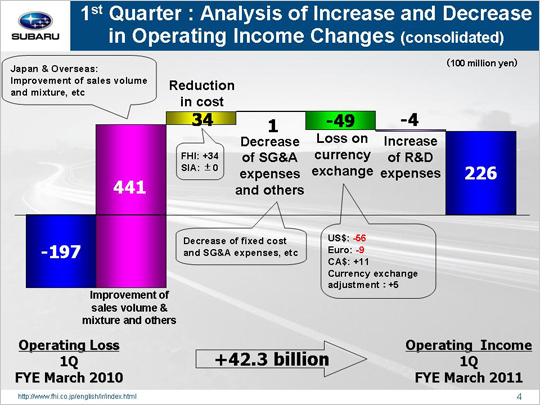
| Let's look at the reasons behind the year-on-year increase in operating income from negative 19.7 billion yen to positive 22.6 billion yen. The primary factor for the profit upswing was an increase of 44.1 billion yen improvement of sales volume and mixture and others, which can be broken down into three areas. First, domestic sales led to a growth by 0.7 billion yen. Though the new car effects of Legacy ran its course, other passenger cars and minicars units sales was increased. Second, overseas sales contributed 41.8 billion yen, as unit sales were up across all markets and sales volume and mixture were improved. And, third, inventory adjustments resulted in a 1.6 billion yen increase. Reduction in cost of materials helped push operating income up 3.4 billion yen, with FHI contributing 3.4 billion yen, and Subaru of Indiana Automotive, Inc. (SIA) zero. Reduction in cost effort gain 4.2 billion yen for FHI, but material price raise cut this by 0.8 billion yen. Similarly, reduction in cost effort lower materials costs of 1.2 billion yen for SIA, but material price hike cut this by 1.2 billion yen. Decrease of SG&A expenses led to a 0.1 billion yen operating income gain, which can be broken down into the following three areas. First, lower fixed manufacturing costs brought in 0.5 billion yen gain. Of this amount, FHI contributed 0.9 billion yen due to reduced expenses associated with suppliers' dies, while SIA contributed negative 0.4 billion yen attributed to increased fixed processing costs. Second, lower SG&A led to a 0.6 billion yen increase in operating income. Overall, FHI contributed negative 1.6 billion yen, as an increase in unit sales also resulted in higher freight charge and shipping costs. Whereas, efforts by domestic dealers to cut SG&A and other expenses through the integration of distributors continued to be resulted in a gain of 1.3 billion yen. Subaru of America, Inc. (SOA) also contributed 1.4 billion yen, despite a 0.1 billion yen decrease caused by higher SG&A, cutting the incentive by 950 dollars per unit from 2,000 dollars for 1Q 2009 to 1,050 dollars for 1Q 2010 brought in a 1.5 billion yen increase in operating income. At our Canadian subsidiary, higher incentives led to reduced operating income by 0.1 billion yen, and by 0.4 billion yen at other subsidiaries. Third, an increase in costs associated with warranty claims that led to a loss of 1 billion yen which we had made an allowance for Legacy recalls. A major factor for the profit downturn was exchange rate fluctuations generating a loss of 4.9 billion yen. 5.6 billion yen of this was attributed to a 6 yen appreciation against the U.S. dollar, while 0.9 billion yen resulted from a 9 yen appreciation against the Euro. However, these losses were partially offset by a 9 yen depreciation against the Canadian dollar, which boosted operating income by 1.1 billion yen. Currency exchange adjustments for purchases between FHI and our international operating subsidiaries led to a 0.5 billion yen gain. Finally, R&D cost increases dented operating income by 0.4 billion yen (up from 8.4 billion to 8.9 billion). Based on each of these factors, operating income was up 42.3 billion yen to 22.6 billion yen. |